


.png)

Summary
Running biomechanics analysis measures how the body moves and the forces acting on it during each stride. Common measurements include cadence, stride length, and ground contact time, along with how the hips, knees, and ankles bend, move from side to side, and rotate as a person runs. When force data is added, researchers can also analyze ground reaction forces and the forces that create rotation at each joint.
Researchers use those measurements to compare runners, track changes between sessions, and test how footwear, training, surface, or terrain alter running mechanics.
Many of the movements researchers want to measure happen in three dimensions, as the joints don’t simply bend forward and backward. They also move from side to side and rotate, and some of those movements are difficult to measure accurately from a single camera view. That’s why detailed running analysis has traditionally relied on 3D motion capture using several cameras positioned around the runner.
For much of the field's history, reliable 3D motion capture also required a controlled laboratory environment, which often meant collecting running data on a treadmill. Treadmill running reproduces most overground mechanics, but it can’t reproduce every research condition, such as changing terrain and slope, corners, or natural changes in pace.
In this article, we explain why running often requires three-dimensional measurement, how traditional marker-based motion capture produces that data, and why treadmill collection is common in running biomechanics research.
We then look at how markerless motion capture can collect three-dimensional running data in less controlled environments, and what the research says about the accuracy and repeatability of this approach. We also use Theia3D, our markerless motion capture software, as a practical example of how these systems track the body and take running analysis outside the traditional lab.
Why Running Often Requires 3D Measurement
The challenge underpinning most running analysis is that different camera angles reveal different parts of the movement. From the side, for example, one leg repeatedly passes behind the other and is partly hidden. A side view can show movements such as knee flexion and extension clearly, but it provides much less information about pelvic drop or rotation. A side view also provides limited information on ankle inversion and eversion. Other camera positions reveal different movements.
Running also varies slightly from stride to stride, so researchers need to distinguish genuine changes in the runner’s movement from error in the measurement system.
For these reasons, detailed running biomechanics is often measured in three dimensions. Several synchronized camera views are combined to reconstruct the runner’s movement in 3D.
3D Marker-Based Motion Capture
When it comes to analyzing running biomechanics, marker-based motion capture has been the reference standard for decades. Its ability to track movement precisely, combined with a long history of research and validation, has made it the benchmark against which newer approaches are still compared.
For instance, a study comparing skin-mounted markers with markers fixed directly to the tibia and femur during running found good agreement when measuring knee flexion and extension, while also identifying larger errors for smaller rotations in the other planes.
That long track record means researchers have a well-established understanding not only of what marker-based systems measure well, but also of where sources of error can occur.
Marker-based motion capture does, however, require a fairly structured collection process:
- Participant preparation takes time, since reflective markers must be placed carefully on specific anatomical landmarks before data collection begins. In a 2025 Scientific Reports study, applying a 39-marker full-body set took around 20 to 30 minutes per participant.
- The collection environment needs to be controlled. Traditional optical systems use infrared cameras to detect reflective markers, and ambient infrared light can interfere with that detection. Laboratories commonly control daylight and other sources of infrared light during collection.
- Markers don’t move exactly with the underlying bones. Because markers are attached to the skin, movement of skin and other soft tissue can introduce what researchers call soft tissue artifact, a well-known source of measurement error.
- Marker placement can vary between sessions and operators. Even when researchers follow the same placement protocol, markers may not be positioned in exactly the same location each time. One study of anatomical landmark identification on the pelvis and lower limb reported inter-technician precision of 13 to 25 mm and repeat measurements by the same technician of 6 to 21 mm.
These requirements are part of the tradeoff of a controlled laboratory setup. They allow researchers to standardize conditions, keep runners within a defined capture area, and, when an instrumented treadmill is used, collect force data across consecutive strides.
Why Treadmills Are Common in Running Biomechanics
The practical requirements of 3D motion capture help explain why many running studies are conducted on treadmills. A treadmill keeps the runner within a fixed capture volume and allows researchers to control speed across repeated strides. When the treadmill is instrumented, researchers can also record ground reaction forces for every step, making it possible to combine movement and force data across many consecutive strides in gait analysis software.
The tradeoff is that researchers then need to consider how closely treadmill running represents running overground.
- A 2019 study pooled 33 cross-over studies comparing motorized treadmill and overground running in 494 participants. Most biomechanical measures were similar between the two conditions, but the authors found several differences, particularly in sagittal-plane movement at footstrike. For example, the foot-ground angle at footstrike was 9.8 degrees lower during treadmill running. Contact time was also 5.0 milliseconds longer, and peak propulsive force was 0.04 body weights lower. The evidence for these differences was rated low or very low, and the authors cautioned against assuming that treadmill and overground biomechanics are identical.
- Treadmill collection isn't limited to marker-based studies. Moran and colleagues conducted a three-session study of 21 experienced runners to test the repeatability of markerless motion capture during running. All testing took place on a treadmill at 0% incline. The authors therefore cautioned against applying their findings directly to other testing environments, including overground running.
How 3D Markerless Motion Capture Works
The practical requirements of marker-based capture have traditionally kept much of 3D running analysis within controlled environments. Markerless motion capture changes the collection process by removing the need to attach physical markers to the runner.
Instead, motion analysis software identifies anatomical landmarks directly from video and uses them to reconstruct movement in three dimensions. Different systems do this in different ways. Some use deep learning to estimate body position, while others rely on silhouettes or body-shape models.
Because there are no markers to apply, runners can usually wear their own clothing and shoes, with preparation focused instead on setting up and calibrating the cameras. Markerless systems also work from standard video rather than detecting infrared reflections from physical markers, so data can be collected in well-lit indoor or outdoor environments.
For many years, though, accuracy was the main challenge. Earlier video-based approaches struggled to match marker-based systems during fast or complex movements, particularly when limbs crossed in front of one another.
Advances in deep learning pose estimation have substantially narrowed that gap. But identifying anatomical landmarks in video is only the first step. To reconstruct those landmarks in three dimensions, markerless systems need synchronized views from multiple cameras.
Reconstructing 3D Movement From Multiple Camera Views
Each camera aimed at a runner provides a two-dimensional view. When the same anatomical landmark is visible in several synchronized, calibrated camera views, the software can triangulate its position in three-dimensional space. That makes camera coverage, synchronization, and calibration central to the quality of the final 3D measurement.
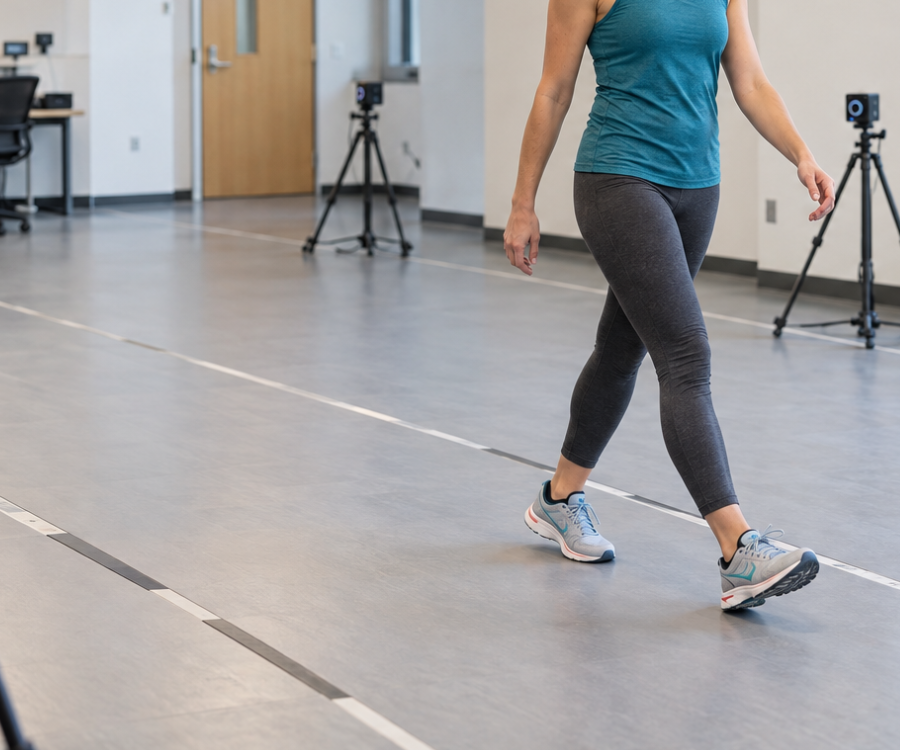
For Theia3D, camera coverage is especially important. It's recommended to use eight cameras for capture volumes so that each joint is visible in at least three camera views whenever possible. This allows the system to determine its position in depth.
The cameras also need to be synchronized so that every view represents the same instant in time. At 4 m/s, a runner travels 4 mm every millisecond, so even a few milliseconds of timing difference can create roughly centimeter-scale differences between camera views.
Finally, the software needs to know where each camera is positioned and which direction it is facing within the same reference frame. In Theia3D, this is established through calibration. An operator records a calibration board or wand moving through the capture area, allowing the software to determine the position and orientation of each camera before the running trials are analyzed.

Finding the Body in Each Frame
After calibration, the software detects the body itself in each video frame rather than searching for reflective markers. Theia3D's models were trained on more than 100 million images spanning over 1,000 different environments, and they identify more than 120 anatomical landmarks on each visible person in every frame.
That range of training is what allows the system to recognize landmarks across different runners, clothing, footwear, lighting, and limb positions, including when one limb passes in front of another.
Because this step is automated, it doesn't depend on where an operator placed a marker, which removes one of the main sources of variation between sessions.
Building the Three-Dimensional Model
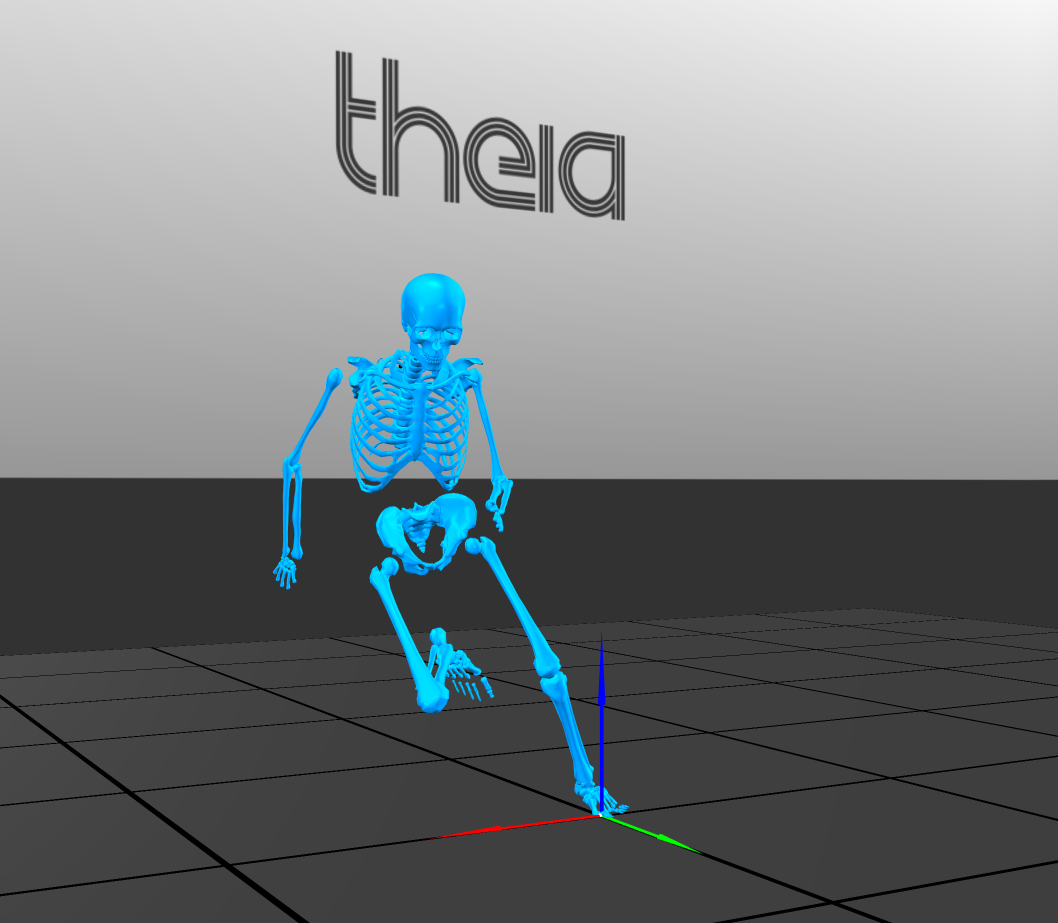
Each camera in the setup produces a flat set of landmark positions. The software then combines the views from every camera, using the calibration values, to work out where each landmark sits in three-dimensional space. A scaled body model, a moving 3D model of the body, is then fitted to those positions.
Theia3D's body model has 17 segments. The software adjusts the model's joint angles until it lines up with the triangulated landmarks, and those joint angles are the output. Optionally, Theia3D can gap-fill brief occlusions and smooth each trial with a Generalized Cross-Validation Spline (GCVSPL), and save both the filtered and unfiltered poses.

With Theia3D, this reconstruction occurs after the session rather than during it. The cameras record the trial, and Theia3D builds the three-dimensional model afterward, so the numbers arrive once processing finishes.
The system also tracks multiple runners simultaneously, as long as each person stays visible in at least three camera views.
Because markers don't need to be attached to participants, practitioners have reported cutting their collection and processing time by over 80 percent compared with marker-based capture workflows. Theia3D exports .C3D and .JSON for biomechanical analysis, plus .FBX for animation. Results can feed directly into Visual3D, Vicon Nexus, Qualisys Track Manager, Python, and MATLAB.
Theia3D runs locally on NVIDIA graphics cards, so video, participant, and analysis data stay on the user's own system.
Running Analysis Outside the Lab
JJ Hannigan's team at Oregon State University-Cascades wanted to see whether Theia3D could capture the running biomechanics they needed on outdoor trails. They had found that IMUs weren't giving them the kinematic data they needed outside the lab, so they tested Theia3D instead to measure running mechanics and factors related to running efficiency on those surfaces.
His team built a portable setup of ten Sony RX0 II cameras recording at 120 frames per second, aimed at the center of the capture area. Two of them focused on the feet to catch ankle movement. All the cameras ran over Ethernet to a network switch and a laptop.
Setup took around 20 minutes, with calibration and packing up adding another 10 to 20 minutes. Trials were processed afterward in batches using Theia3D Batch, which processes hundreds of trials without supervision, based on a trial list and calibration files.
The conditions included natural trail surfaces, direct sun, changing slope, and unpredictable weather. The team ran two separate experiments.
- In the first study, 14 participants ran on paved surfaces and on dirt single-tracks, in traditional and maximal shoes.
- In the second, 15 participants ran downhill on rough terrain in three types of footwear, including shoes without traction lugs.
Both studies found differences in hip and ankle motion between surfaces and between footwear conditions.
They also found that the durable, portable cameras used in the experiments handled the terrain and the changing light well, and their fixed, wide-angle lenses captured full strides even on uneven ground, explaining how running mechanics change on such terrain.
The Accuracy of Markerless Motion Capture in Running Analysis
When markerless motion capture is used for running and video gait analysis, its performance comes down to two separate questions:
- How closely does it agree with a marker-based system measuring the same movement?
- Does it produce consistent results when the same runner is measured again on another day?
The answer to both depends on what’s being measured, including whether the goal is to compare joint angles, timing variables, or asymmetries between sides. Agreement varies by joint and by plane, and it can change with running speed. The studies below describe what researchers have found specifically for running.
Agreement with Marker-Based Capture
Varcin and Boocock's systematic review, published online in December 2025, included 16 studies involving 303 participants. Two studies directly compared lower-limb running kinematics measured with Theia3D and marker-based motion capture, and the review rated the quality of that evidence as moderate.
During running, the smallest differences were found for hip abduction/adduction, with RMSD values of 2.7 to 4.5 degrees. Ankle dorsiflexion/plantarflexion ranged from 3.8 to 5.1 degrees, while knee flexion/extension ranged from 4.2 to 4.8 degrees. Knee abduction/adduction had an RMSD of 7.2 degrees, and ankle abduction/adduction 6 degrees. The largest differences were found for hip flexion/extension, at 5.2 to 13.8 degrees, and for internal/external rotation, which ranged from 8 degrees at the ankle to 12.8 degrees at the hip.
The authors caution against treating marker-based measurements as an error-free reference, particularly for transverse-plane rotation. Soft-tissue movement, marker placement, occlusion, camera perspective, and differences in how anatomical axes are defined can all contribute to disagreement between the systems.
Spatiotemporal measurements also showed strong agreement with an instrumented pressure treadmill. Moran and colleagues (in a paper we cited earlier) found intraclass correlation coefficients (ICCs) of 1.0 for cadence, 1.0 for step length, and 0.982 for stance time. The mean difference in stance time was just 1 millisecond, less than the treadmill's 10-millisecond sampling interval.
Sprinting has also been tested at higher speeds, where motion capture has to track much faster movement. A study published online in the Journal of Sports Sciences compared Theia3D with marker-based motion capture in 14 physically active adults during early acceleration, mid-acceleration, and top speed. For the sagittal-plane joint and segment angles measured, standard error of measurement stayed below 5 degrees for most variables, while knee, thigh, and shank angles showed excellent agreement across all three sprint phases.
Differences were larger at top speed, particularly for the hip, pelvis, and foot and at touchdown. Agreement dropped at top speed, most noticeably at the hip, pelvis, and foot.
Repeatability: Measuring the Same Runner Again
Kanko and colleagues studied 30 adults running on an instrumented treadmill. Each participant ran once in standard motion-capture clothing and once in their own athletic clothing, with 26 participants included in the kinematic comparison.
Across the two markerless recordings, inter-condition variability averaged 2.0 degrees, compared with 1.5 degrees of cycle-to-cycle variability within each markerless trial. When markerless and marker-based measurements from the same run were compared, RMSDs were 5.2 degrees or less for sagittal-plane joint angles and hip abduction/adduction, and between 6.0 and 9.8 degrees for the remaining frontal- and transverse-plane angles. Differences between the two markerless trials were smaller for every joint angle than differences between the markerless and marker-based systems.
More of the published Theia3D repeatability work has focused on walking than running. A 2025 study had 22 adults walk overground in two sessions an average of six days apart, completing trials in both tight- and loose-fitting clothing at each session. Average inter-trial variation was under 2 degrees, inter-session variation under 3 degrees, and RMSD between clothing conditions under 2 degrees.
Not all variation between sessions necessarily comes from the measurement system, since a person's movement also varies naturally from trial to trial. In Moran and colleagues' three-session running study mentioned earlier, inter-session variability remained below within-trial variability for every joint angle measured, with an average ratio of 0.67.
Measure Running Where It Actually Happens
Talk to our team about how Theia3D can bring running analysis beyond the traditional motion capture lab, and how it can fit into your existing research or performance workflow.
Disclaimer: This article summarizes motion analysis approaches for research and performance applications. Theia3D is a motion analysis software platform and is not intended to diagnose or treat medical conditions. Interpretation and application of results are the responsibility of the user.