


.png)

Summary
Pitching biomechanics measures how a pitcher produces a throw, using joint angles, segment velocities, and the forces and torques acting at the shoulder and elbow. The analysis runs from front-foot contact through ball release and arm deceleration, and it looks at the whole body rather than the throwing arm alone.
During a pitch, rotational speed builds through the body in sequence. The pelvis accelerates first, followed by the trunk, upper arm, forearm, and hand. Measuring when each segment reaches peak speed, and how much time separates those peaks, shows how the delivery is sequenced and how motion is transferred from the lower body to the throwing arm.
Motion capture shows how those mechanics unfold over time. It can measure stride length, pelvis rotation, trunk rotation timing, arm position, and other variables frame by frame, showing not just where the body moves but when each part of the delivery occurs. Those measurements can then be compared across pitches or sessions, provided the same events and reference frames are defined consistently.
Motion capture also helps quantify the physical demands of pitching. Throwing places high loads on the shoulder and elbow, and measurements of the body’s motion can be combined with biomechanical models to estimate forces and torques at those joints.
This article walks through the mechanics of the pitching delivery, including the kinematic chain, hip-shoulder separation, and the loads placed on the elbow and shoulder. It then explains how motion capture technology measures those mechanics, and where marker-based and markerless systems differ in setup, capture environment, and measurement error. We use Theia3D, our own markerless motion capture software, as the example throughout.
The Six Phases of Pitching and Their Reference Events
Pitching is commonly divided into six phases: windup, stride, arm cocking, arm acceleration, arm deceleration, and follow-through. Diffendaffer and colleagues' clinical review of pitching biomechanics uses this six-phase framework.
The transition from one phase to the next is marked by a specific event in the delivery. Three of these are especially important during the throw itself:
- Foot contact marks the start of arm cocking.
- Maximum shoulder external rotation marks the transition from arm cocking to arm acceleration.
- Ball release ends arm acceleration and begins arm deceleration.
These events give biomechanists specific moments at which to measure the pitch rather than treating the delivery as one continuous motion.
Those events also happen very close together. In Dillman and colleagues' 1993 study of 29 elite college and professional pitchers, the average time from foot contact to ball release was 0.145 seconds, with a standard deviation of 0.015 seconds. The authors report that the final 20 percent of that interval lasted about 0.029 seconds. During that period, the shoulder rapidly rotated internally from maximum external rotation toward its position at ball release.
Using the same start and end points for arm acceleration (maximum shoulder external rotation to ball release), a study in The American Journal of Sports Medicine measured the phase at approximately 50 milliseconds in 15 major league pitchers.
Dillman's cameras recorded at 200 Hz, or one frame every 5 milliseconds (at 200 Hz, a 29-millisecond interval spans only about six frames). This is why frame rate matters so much in pitching analysis: when major changes in arm position happen within a few hundredths of a second, the system needs enough frames to locate events such as maximum external rotation and ball release precisely.
These events also serve as measurement points, allowing joint angles and segment positions to be compared at the same moments in the delivery.
The Kinematic Chain and Pelvis-to-Trunk Timing
Pitching uses a kinetic chain to move energy from the lower body through the pelvis and trunk and into the throwing arm. The order and timing of those movements matter because the contribution of one segment affects what the next segment can do.
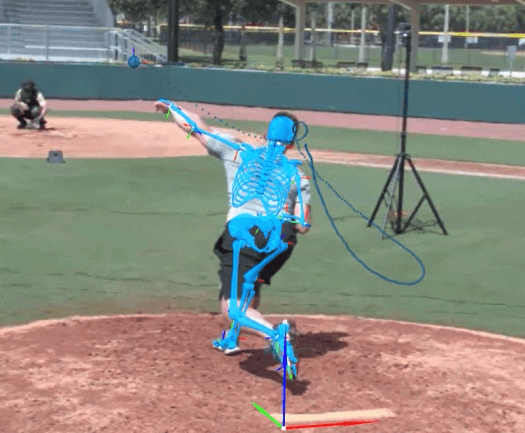
Fortenbaugh and colleagues' 2009 review focuses in particular on the timing between pelvis and upper-trunk rotation. If the interval from foot contact to ball release is expressed as a percent, the studies they reviewed place peak pelvis rotation velocity at about 28 to 35 percent of that interval and peak upper-trunk rotation velocity at about 47 to 53 percent. That puts the two peaks roughly 18 to 22 percent of the pitch cycle apart.
The review also summarizes how that separation was measured across different levels of play. In the study it cites, the timing of peak pelvis rotation and peak upper-trunk rotation didn’t differ significantly between youth, high school, college, and professional pitchers when each was considered separately.
The gap between those peaks was about 11 percent of the foot-contact-to-release interval in youth pitchers, 12 percent in high school pitchers, 17 percent in college pitchers, and 18 percent in professional pitchers. Fortenbaugh and colleagues describe those differences in separation timing as significant.
That timing also matters for performance. Fortenbaugh and colleagues cite studies linking proper separation between pelvis and upper-trunk rotation with higher ball velocity, while poor timing between the two is associated with lower velocity. In other words, it is not just how fast the pelvis and trunk rotate, but when each reaches peak speed relative to the other.
Hip-Shoulder Separation
This is the difference between how far the pelvis and trunk have rotated toward home plate and is often measured at front-foot contact, when the hips have started opening toward the plate while the upper body is still relatively closed. That creates a stretch across the torso before the trunk rotates through.
More separation is often assumed to mean more velocity, but the relationship isn’t that simple. A study in the Journal of Strength & Conditioning Research measured an average of 50 ± 12 degrees of hip-shoulder separation at foot contact in 29 high school and college pitchers. Separation at foot contact was not significantly associated with ball velocity. Instead, it was related to peak trunk rotation velocity, and peak trunk rotation velocity explained 25 percent of the variation in ball velocity.
That makes hip-shoulder separation more useful as part of the sequencing picture than as a number to maximize on its own. In an assessment, it helps show how far the pelvis has moved ahead of the trunk and what happens as the trunk then accelerates toward the plate. The reported angle also depends on how the pelvis and trunk segments are defined, so separation values should only be compared when they were calculated the same way.
What Actually Produces Velocity
How much the lead leg straightens after front-foot contact is strongly associated with pitch velocity. Dowling and colleagues analyzed 322 professional pitchers and found that the harder throwers straightened their lead knee much more between front-foot contact and ball release. The high-velocity group averaged 17 ± 13 degrees of knee extension, compared with 5 ± 14 degrees in the low-velocity group.
Across all pitchers in the study, lead-knee extension was strongly related to ball velocity, accounting for about 35 percent of the variation in velocity. Lead-knee extension velocity showed a similar relationship. Neither measure, however, predicted elbow varus torque in that analysis. In practical terms, pitchers who braced and straightened the front leg more tended to throw harder, without lead-knee extension itself being associated with greater elbow torque.
The fastest movements come later, as the throwing arm accelerates toward release. A study published by the American Orthopaedic Society for Sports Medicine reported elbow-extension velocities of up to about 2,700 degrees per second and shoulder internal-rotation velocities of up to about 7,500 degrees per second.
The arm also experiences some of its largest loads around the transitions into and out of that acceleration. Near maximum shoulder external rotation, the arm has reached the end of its backward rotation and is about to accelerate toward the plate. High shoulder torques and elbow varus torque occur around this part of the delivery. Then, immediately after the ball leaves the hand, the job reverses. The shoulder muscles have to slow a rapidly moving arm while resisting forces that pull the upper arm away from the shoulder.
The Load on the Elbow and Shoulder
Where the Load Comes From
The same sequence that produces pitch velocity also creates large loads at the shoulder and elbow. As the pelvis and trunk rotate toward the plate, the throwing arm stays back, then accelerates rapidly toward ball release. After release, the shoulder has to slow the arm down again.
In a classic study of 26 skilled adult pitchers, Fleisig and colleagues calculated about 64 newton-meters of elbow torque and 67 newton-meters of shoulder torque near maximum shoulder external rotation. During arm deceleration, they calculated more than 1,000 newtons of compressive force at the shoulder.
These are estimates of the mechanical load acting at the joint, calculated from the pitcher’s movement, but shouldn’t be read as the amount of force carried by any single ligament, tendon, or muscle.
How Mechanics Change the Load
Two pitchers can throw at similar speeds while putting very different loads on their elbows. Delivery mechanics are part of the reason.
Aguinaldo and Chambers analyzed 69 adult pitchers, including 58 collegiate, eight minor-league, and three major-league players. Of those pitchers, 34 began rotating their trunks before the front foot landed. Their average elbow valgus torque was 59 ± 27 newton-meters. The 35 pitchers who began trunk rotation after front-foot contact averaged 42 ± 29 newton-meters.
Ball velocity wasn’t significantly different between the two groups. In other words, the pitchers who rotated earlier weren’t simply putting more load on the elbow because they were throwing harder. The timing of the delivery was associated with a substantial difference in elbow load.
The relationship between velocity and elbow load becomes even clearer when pitchers are compared with themselves rather than with each other. A study published in the Journal of Athletic Training analyzed fastballs from 64 professional pitchers. Across different pitchers, ball velocity explained just 7.6 percent of the variation in elbow varus torque. A pitcher who threw harder than another pitcher therefore didn’t necessarily have the higher elbow load.
Within the same pitcher, however, the relationship was much stronger. The researchers' within-pitcher model found that velocity explained 95.7 percent of the variation in elbow varus torque. So velocity still matters. When the same pitcher throws harder, elbow load tends to rise with it. But velocity alone tells you relatively little about why one pitcher places more load on his elbow than another. For that, you also need to look at how each pitcher moves.
Measuring Pitching Biomechanics Reliably
Why Pitching Turned to Motion Capture
Most of the key movements in a pitch happen within a few tenths of a second between front-foot contact and ball release. In that brief interval, the pelvis and trunk rotate, the throwing shoulder reaches maximum external rotation, the elbow extends, and the arm accelerates into release.
A coach can see the overall delivery on video. What’s much harder to judge by eye is exactly when those movements happen, how fast each body segment is moving, or whether one part of the sequence occurs a few milliseconds earlier or later from one pitch to the next.
That’s what motion capture enables. By tracking the pelvis, trunk, upper arm, forearm, and other body segments throughout the pitch, it can calculate joint angles, segment velocities, and the timing between movements. With a biomechanical model, those measurements can also be used to estimate forces and torques at the elbow and shoulder.
Optical motion capture generally takes one of two approaches: marker-based or markerless. Both reconstruct the pitch in three dimensions, but they differ in how they locate the body, how much preparation the athlete requires, and where the system can be used.
Marker-Based Versus Markerless Capture
Marker-based optical motion capture has long been the reference method for measuring human movement, but data collection starts with preparing the athlete. In a recent workflow study, Fleischmann and colleagues used a 39-marker full-body gait set that took roughly 20 to 30 minutes to apply before recording began.
Where those markers are placed matters because their positions determine the body segments used to calculate joint angles. Another study showed that shifting some knee and ankle markers by 10 mm, roughly the width of one marker, could change calculated transverse-plane angles by as much as 7.59 degrees. The exact effect depends on the marker, direction, joint, and model, but the practical problem is straightforward: differences in marker placement between sessions can look like changes in the athlete's mechanics.
Markerless capture removes that preparation from the athlete. Synchronized cameras record the pitcher, and software reconstructs 3D movement from the video. The pitcher can play in normal athletic clothing, and the next athlete can step into the same calibrated capture area without having another marker set applied.
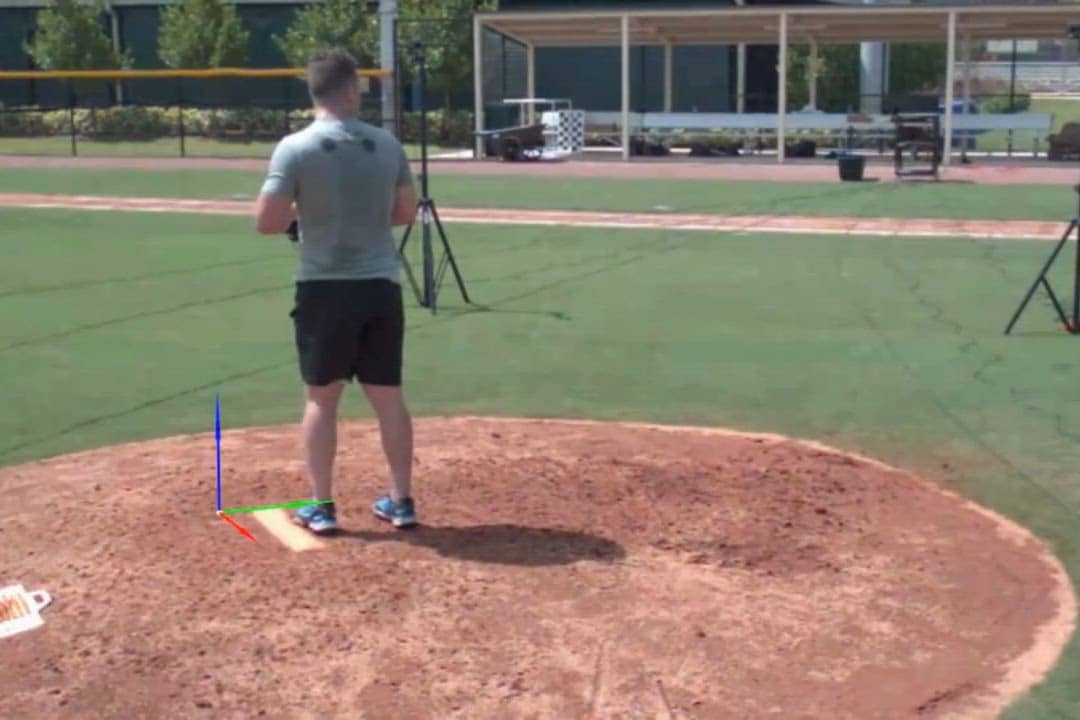
The setup hasn’t disappeared but has moved to the cameras. These still need to be positioned, synchronized, and calibrated with enough views of the pitcher to reconstruct the movement.
With Theia3D, at least six cameras are needed, and joints must remain visible from multiple angles. If an elbow disappears behind the torso or catcher in one view, other cameras may still see it. If too many views are blocked, tracking can deteriorate.
Markerless capture also has measurement error. In a recent validation study of 18 collegiate pitchers throwing max-effort fastballs, stride length showed strong agreement with marker-based capture, while shoulder rotational measurements were more variable. The practical question is therefore not which system is error-free, but which setup produces the measurements you need with acceptable repeatability and workflow demands.
Both approaches can produce the 3D movement data used in pitching analysis. The next section uses Theia3D as a markerless example to show how a pitch is captured and converted into measurable biomechanics.
How a Markerless System Captures a Pitch
From Video to a 3D Body Model
Theia3D identifies anatomical landmarks in multiple camera views, triangulates their positions into a shared 3D coordinate system, and fits a body model to the resulting points.
In a pitching context, this captures the full mechanical sequence that produces a pitch, from the start of the leg lift through ball release and follow-through, so the body and the ball can be analyzed in one synchronized capture space.

How the Camera System Is Set Up
Theia3D works in any environment where a multi-camera array can be set up, working with at least 6 well-placed cameras recording fully synchronized video at 300 frames per second (although eight cameras are generally recommended).
The system works with a range of off-the-shelf and custom cameras, including Sony RX0 II, Qualisys Miqus, FLIR Blackfly S run through Vicon Nexus, and Contemplas solutions, so a program can build on hardware it already owns rather than buy a single-vendor stack.
Setup typically takes around 30 minutes, including calibration, which is automatic and uses either a standard wand or Theia's proprietary calibration board in the capture area.
The desktop application then uses the parameters from that calibration to work out where key points on the athlete's body, the bat, and the ball sit in 3D space. The system tracks 124 anatomical keypoints per frame and fits a scaled skeletal model to those keypoints, which produces a complete kinematic dataset for every pitcher in the volume. The deep learning models behind this were trained on more than 100 million images spanning more than 1,000 different environments.
Theia3D is post-processing software rather than a real-time system. It runs on a local workstation with a CUDA-capable NVIDIA graphics card of at least 8 GB and compute capability 7.0 or greater. The processor floor is quad-core, and the memory floor is 24 GB of RAM, with 32 GB recommended. Theia recommends a desktop over a laptop. Results are typically available within minutes of capture.
Capturing the Ball Alongside the Body
Because the baseball tracking system records the whole environment rather than only the ball, Theia3D reconstructs the ball's continuous 3D trajectory frame by frame and captures the exact release point from the pitcher's hand.
This camera-based approach derives ball velocity from how the ball’s position changes across successive frames. Radar remains the better tool for spin, which camera systems measure less reliably.
Because the body and ball are captured together, a coach can see which mechanics belong to which pitch without having to synchronize separate biomechanics and ball-tracking datasets afterward.
Theia3D's Bat Tracking add-on extends the platform to capture synchronized bat path and full-body mechanics in the same session, which is useful for hitting analysis and for facilities that run both pitching and hitting evaluations on the same hardware.
What the System Measures and Exports
For pitchers, the most useful outputs describe the pitching motion in detail, including lower-body stride and landing measures, lead-leg mechanics, pelvis and trunk rotation kinematics and timing, hip-shoulder separation, shoulder and arm kinematics, and estimated elbow and shoulder loading metrics. The system exports this data in the industry-standard .C3D, .FBX, and .JSON file formats. Those outputs can include joint angles, segment timing, and angular velocity across the pitching motion.
Exported data can be merged with synchronized force plate, electromyography (EMG), treadmill, or other peripheral data in software such as Visual3D, which gives a program a complete biomechanical picture. All data processed by Theia3D is stored entirely locally. No video, participant, or analysis data is transmitted to Theia or any outside provider, so the program owns its raw data outright.
Processing the Whole Pitching Staff
Once the camera array is calibrated for a given capture space, athletes can rotate through a session with no setup or calibration between throws. Theia3D also ships with a companion application called Theia3D Batch, which lets a program configure the analysis once, queue hundreds of trials, and process them one after another in the background without manual intervention.
Validated Against a Marker-Based Reference on Maximum-Effort Fastballs
Aguinaldo and colleagues tested Theia3D and an in-stadium Hawk-Eye system against marker-based motion capture during maximum-effort pitching. Eighteen NCAA Division I and II pitchers each threw 10 fastballs from a mound at Petco Park. The portable setup used 10 Qualisys Miqus video cameras for Theia3D and eight synchronized Qualisys Arqus cameras for the marker-based reference. Hawk-Eye used five high-speed cameras installed around the stadium.
After pitches with incomplete marker tracking or corrupted video were removed, 104 pitches from all 18 pitchers remained for comparison. Across the body, Theia3D's estimated joint centers differed from the marker-based joint centers by an average of 52.0 ± 12.3 mm. The error was smaller around the hips, at roughly 40 to 43 mm, and larger at the elbows, at roughly 70 to 75 mm.
Some pitching measurements agreed much more closely than others. Stride length was the strongest discrete result: Theia3D underestimated it by about 4 cm on average, with a concordance coefficient of 0.92. Elbow flexion at front-foot contact also showed strong agreement. Across the movement waveforms, pelvis rotation produced relatively small errors, while shoulder rotation was harder to reproduce consistently.
The differences became larger for the fastest arm movements and for loads calculated from those movements. Maximum shoulder internal-rotation velocity showed weak agreement, and estimates of shoulder external-rotation torque and elbow valgus torque also varied more from the marker-based reference. Small differences in locating a rapidly moving shoulder or elbow can become larger once those positions are used to calculate rotational velocity and joint torque.
The practical takeaway is that Theia3D was able to measure full-effort pitching in a stadium setting, but the study does not support treating every output as interchangeable with marker-based capture. Measurements such as stride length and some joint motions agreed more closely, while high-speed shoulder motion and calculated arm-loading measures require more caution.
Beyond this study, Theia3D is supported by more than 60 independent, peer-reviewed validation studies spanning gait, sprinting, jumping, and other movements. That broader validation base is relevant for programs that assess athletes across multiple tasks, from pitching mechanics to the functional movement screen and other movement evaluations.
Validation is always specific to a task, so a program should confirm that the evidence available for Theia3D matches the population, movement, environment, and pitch types it plans to measure before relying on it.
Running Full Pitching Staffs at Elite Programs
Theia3D is used by baseball performance centers and universities, including Driveline Baseball, Florida State University, Ohio State University, University of Nebraska Omaha, Maven Baseball Labs, and the PLNU x Padres Biomechanics Lab, whose director, Dr. Arnel Aguinaldo, led the pitching validation study mentioned earlier.
At Driveline Baseball, Theia3D captures full-body pitching mechanics during real training sessions, measuring the pitching motion alongside strength and force plate testing to quantify how an athlete moves and what's limiting outputs like pitch velocity. This is where pitching analysis software becomes useful: it connects full-body movement data with the performance outputs coaches are already tracking.
According to Kyle Boddy, Founder of Driveline Baseball, "We've always believed that data should drive training decisions, not just document them. Theia makes that possible in real training environments, at scale, without disrupting how we work."
Measure the Mechanics Behind Every Pitch
Talk to our team about capturing full-body pitching biomechanics in your bullpen, lab, or stadium, so you can measure pitching mechanics under the conditions your athletes actually train and compete in.
Disclaimer: This article summarizes motion analysis approaches for research and performance applications. Theia3D is a motion analysis software platform and is not intended to diagnose or treat medical conditions. Interpretation and application of results are the responsibility of the user.