


.png)

Summary
The countermovement jump test is one of the most widely used methods to assess lower-body explosive ability, especially as it’s simple to run, takes little time, and can be used almost anywhere.
Coaches and performance staff use it to compare athletes, measure progress after a training block, and track changes in readiness and fatigue over time.
How much those tests can tell you, however, depends on how the jump is measured. For instance, a contact mat measures the time between take-off and landing, then uses that flight time to estimate jump height. A force plate records how force changes throughout the countermovement, take-off, and landing. From that record, you can calculate values like impulse, peak force, take-off velocity, and phase durations.
But these possibilities create a practical challenge. Coaches and researchers have to determine:
- Which measurements are actually relevant to the performance question they’re trying to answer
- Whether the test and its calculations are being carried out the same way from one session to the next
- Whether a change in a result reflects a real change in performance or simply normal measurement variation
This guide looks at how CMJ results are produced and interpreted, including protocol choices such as arm position and countermovement depth, and analysis choices like phase definitions and the method used to calculate jump height. It also examines what force plates can and can’t reveal about how an athlete produced the jump.
From there, we look at how markerless motion capture adds joint-level kinematic data to that picture. Using Theia3D as a practical example, we explain how multi-camera video is converted into 3D movement data, how that data can be combined with force-plate measurements, and what peer-reviewed research says about the accuracy and repeatability of markerless analysis in jumping tasks.
How the Countermovement Jump Works
In the CMJ, an athlete begins in an upright standing position, then drops rapidly into a squat, and jumps as high as possible without pausing at the bottom. That downward movement is the countermovement and differs from a squat jump in that the subject starts from a held position.
The countermovement loads the stretch-shortening cycle, which is why the same athlete almost always jumps higher in a CMJ than in a squat jump.
The jump itself is usually measured with a force plate, a contact mat, an optical measurement system, or a camera-based app.
What the CMJ Analyzes
The test measures how much force an athlete produces against the ground and how quickly they produce it. Coaches and specialists mainly use it to judge the effect of a training block and to track recovery and fatigue.
Jump height is the one output common to every measurement device, while the other data you may get depends on the tool. For example, a contact mat and a video app both resolve the jump to a single quantity (i.e., flight time) and estimate height from it.
Force plates, however, generate far more data than these simpler tools, and not every metric is equally useful or reliable. A single force-time record can produce dozens of metrics, but those metrics differ in both what they describe and how reliably they repeat across testing sessions.
Anicic and colleagues examined this problem by calculating 45 force-platform-derived variables in 79 physically active participants who completed the same CMJ protocol on two occasions, 24 to 48 hours apart. The authors reported that only about half of the variables showed acceptable within- and between-day reliability. Impulse measures were among the most repeatable kinetic variables, with coefficients of variation of 8.3% or less, while none of the rate-of-force-development measures met the study's reliability criteria.
The reliable metrics also described different parts of performance. The researchers grouped them into four broader components: a performance component, an eccentric component, a concentric component, and a jump strategy component.
Because these metrics describe different aspects of CMJ performance, the most relevant measure depends on the question being asked: how high the athlete jumped, how they absorbed and reversed the countermovement, how they produced force during propulsion, or whether their movement strategy changed between tests.
How Protocol Choices Affect CMJ Testing
CMJ protocols vary across the literature. A study published in Frontiers of Physiology reviewed 119 studies involving children and adolescents and found substantial differences in jump technique, trial count, and measurement device. Among studies reporting arm position, 41 used hands on hips and 16 allowed an arm swing.
The reliability results reported by Anicic and colleagues in the previous section came from a standardized protocol repeated across both testing sessions. Participants completed a short warm-up, then performed three maximal CMJs 60 seconds apart with hands on hips and a self-selected countermovement depth. Body weight was calculated from a two-second motionless period immediately before the jump.
These protocol choices directly affect how CMJ results should be interpreted. For repeated testing, arm position, countermovement depth, rest intervals, instructions, and body-weight estimation need to remain consistent. Otherwise, it becomes harder to tell whether a change in the result came from the athlete or from the testing conditions.
Arm Swing Versus Hands on Hips
Arm position can substantially change CMJ height, and the size of that effect varies across populations.
- Lees, Vanrenterghem, and De Clercq tested 20 athletic men performing maximal vertical jumps with and without an arm swing. The arm swing increased jump height by 8.6 cm. About 72% of that gain came from greater take-off velocity, while 28% came from the center of mass being higher at take-off because the arms were elevated.
- Vaverka and colleagues found an even larger effect in 18 elite volleyball players. Their jump height was 38% higher with an arm swing than without one. The arm swing also shortened the braking phase, prolonged the accelerating phase, and increased accelerating impulse.
That variation is why arm position is relevant when CMJ results are compared. A jump performed with hands on hips and one performed with an arm swing are different testing conditions, and normative values from one shouldn’t be treated as interchangeable with the other.
The Lees study also shows that the effect is not simply a matter of raising the arms at take-off. Most of the increase in jump height came from the higher take-off velocity produced during the jump.
How Force Plate Data Is Interpreted
A force plate provides a force-time record, but the metrics reported from that record depend on how the data is processed and organized. Phase definitions and the method used to calculate jump height can therefore affect both the values reported and how they should be compared.
The Six Phases of the Countermovement Jump
Dividing the force-time curve into phases lets you calculate measures such as force, impulse, and duration for different parts of the jump. The exact values depend on where one phase is considered to end and the next to begin.
McMahon, Suchomel, Lake, and Comfort described six phases in the Strength & Conditioning Journal in 2018:
These boundaries are definitions rather than measurements, so a variable computed over the braking phase in one software package isn't necessarily the same variable in another.
How Jump Height Is Calculated
The two common force-plate methods for calculating jump height don’t necessarily return the same value:
- Flight-time method estimates jump height from the time between take-off and landing.
- Impulse-momentum method uses the force recorded before take-off to calculate take-off velocity and, from that, the rise of the center of mass.
A 2023 systematic review of 21 studies concluded that the impulse-momentum method is the most appropriate force-platform method for estimating center-of-mass displacement from take-off to the highest point of the jump. Flight-time estimates can be inflated when the athlete's center of mass is lower at landing than it was at take-off.
A 2020 study illustrates the size of that effect. Participants' center of mass was an average of 5.3 cm lower at landing than at take-off, causing the flight-time method to overestimate jump height by about 2.5 cm. The method nevertheless showed high within-participant reliability, meaning it can still be useful for longitudinal testing when the measurement method is kept consistent.
The practical implication is that jump heights calculated using different methods shouldn’t be treated as interchangeable. For repeated testing, the same calculation method and measurement setup should be used across sessions.
What Force Plates Can and Can't Tell You
A force plate shows how the athlete applied force to the ground throughout the jump. From that force-time record, you can calculate measurements such as peak and mean force, impulse, take-off velocity, jump height, phase durations, and center-of-mass displacement.
What it can’t show is how the athlete's joints produced those results. For example, a 30 cm countermovement depth tells you how far the center of mass dropped, but not how much came from hip flexion, knee flexion, ankle dorsiflexion, or forward trunk bend.
The same limitation applies when performance changes. An increase in propulsive impulse shows that the athlete produced more impulse before take-off, but it doesn’t identify which joints or movement pattern changed. Two athletes can reach the same jump height and take-off velocity using different combinations of hip, knee, ankle, and trunk motion.
That leaves a different question unanswered: how did the athlete move to produce those forces? Answering that requires measuring the movement of the body itself, which is where motion capture can be useful.
How Markerless Motion Capture Adds Joint-Level Data to the Countermovement Jump
Markerless motion capture measures the segments themselves rather than the force underneath them, from ordinary video.
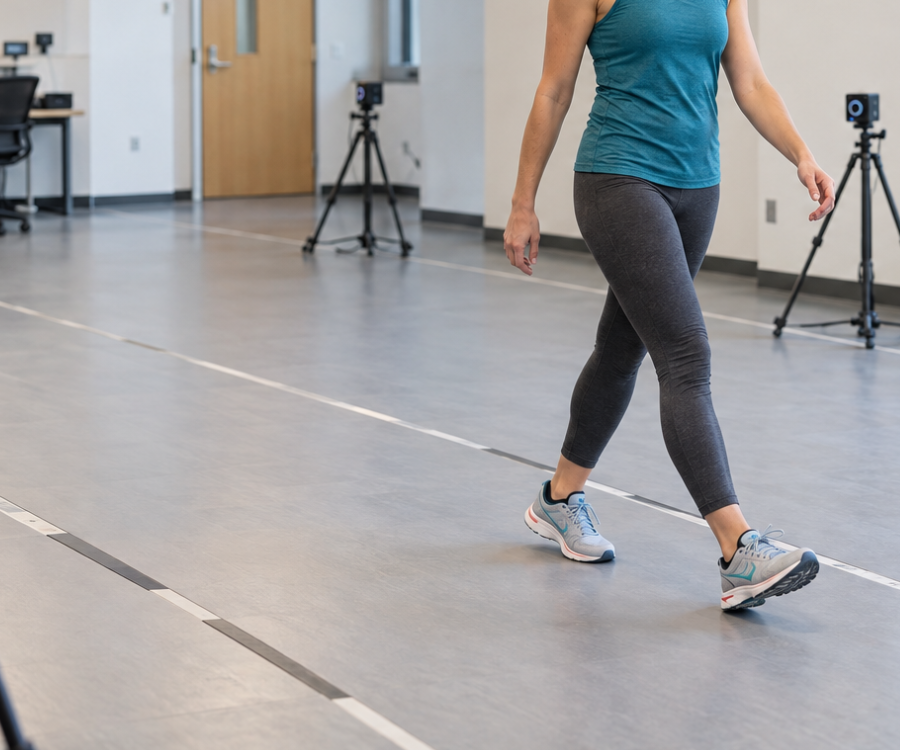
The process starts with several calibrated cameras recording the same jump simultaneously from different angles. The athlete wears normal athletic clothing, with no markers or sensors attached.
In each video frame, the software identifies anatomical landmarks around the body. Because the same landmarks are captured from multiple camera views, their positions can be reconstructed in three dimensions and used to fit a body-segment model.
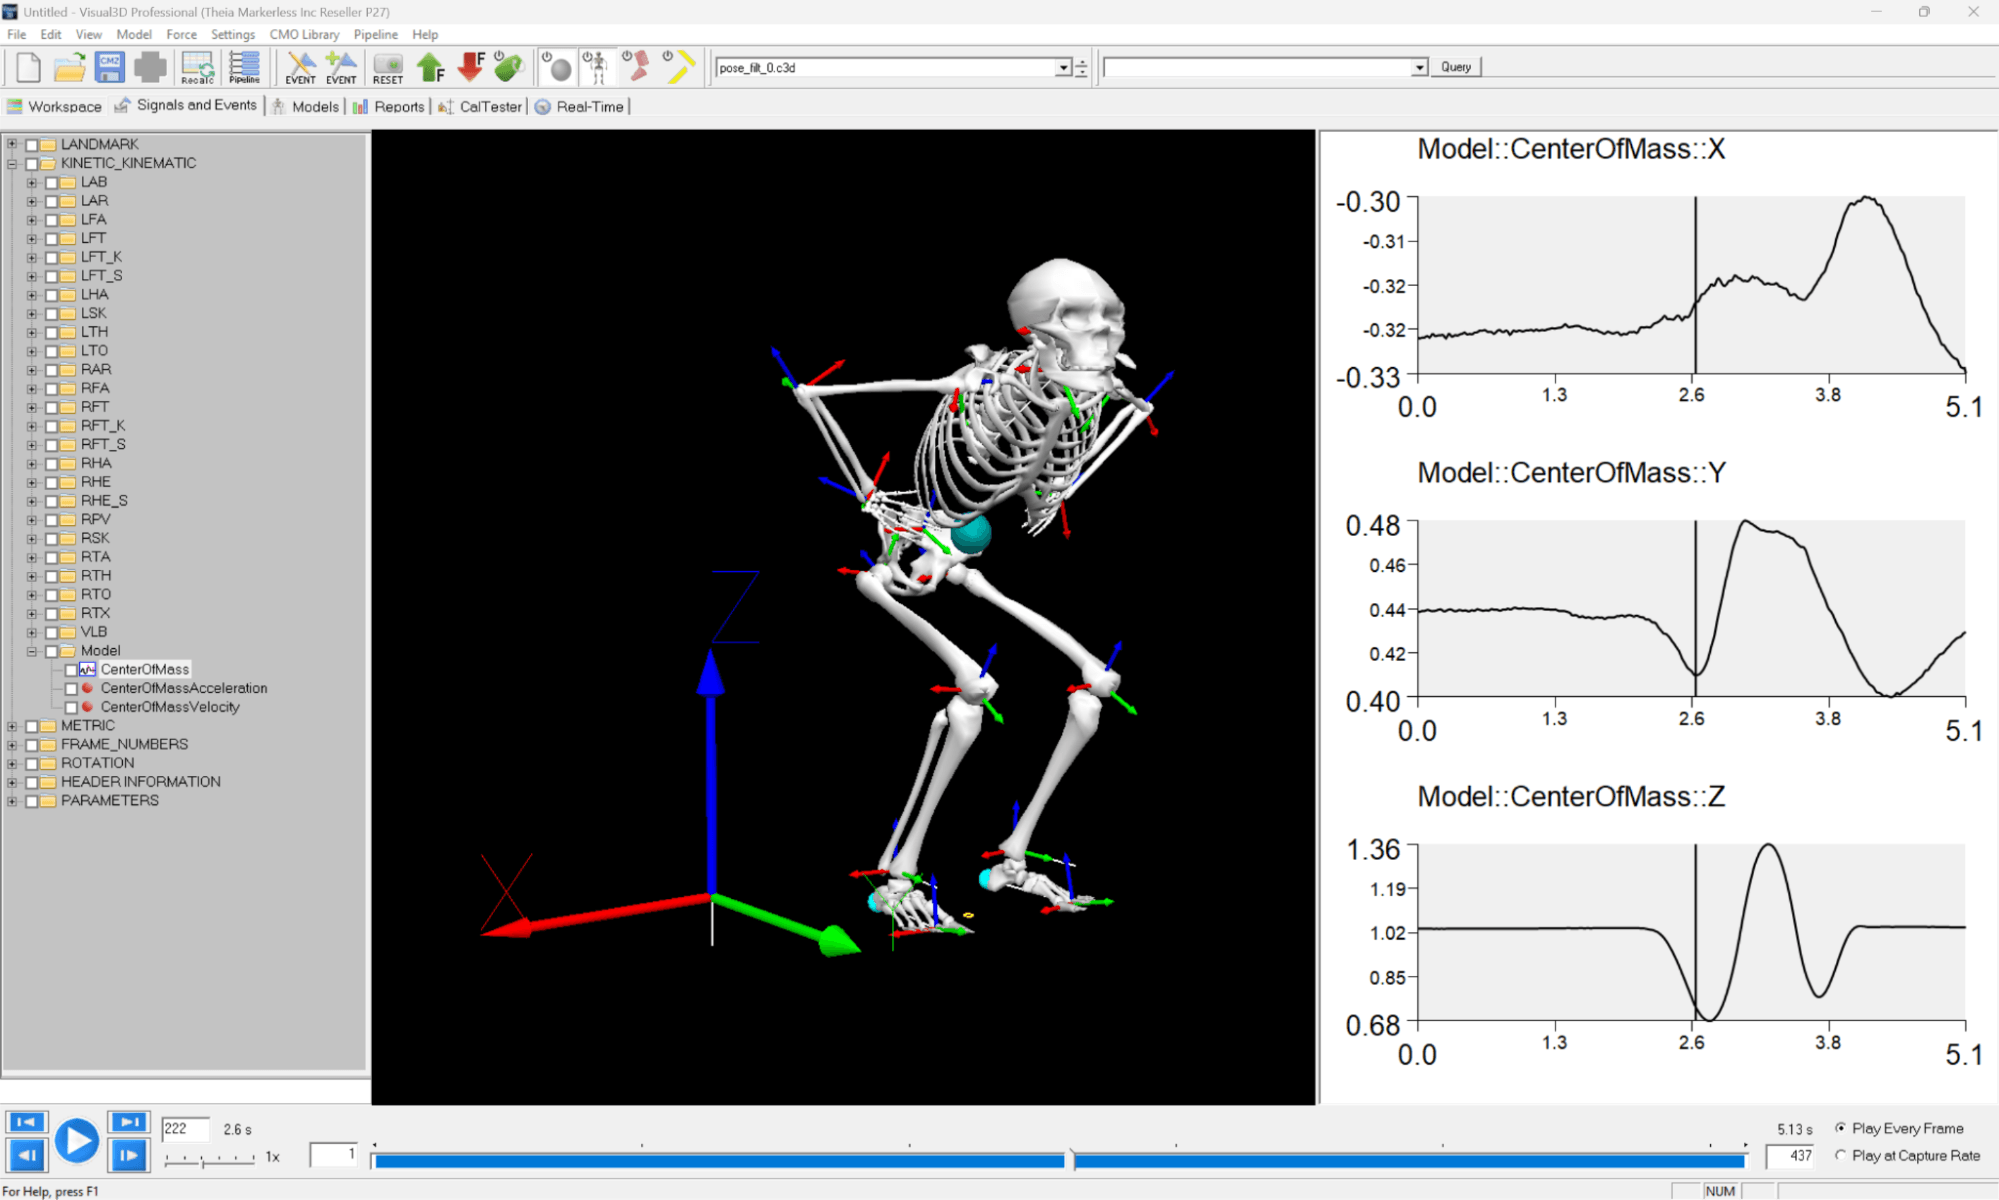
From that model, the system can calculate hip, knee, ankle, and trunk motion frame by frame in the sagittal, frontal, and transverse planes. Instead of simply estimating how far the center of mass dropped, for example, you can see how much of that movement came from hip flexion, knee flexion, ankle dorsiflexion, or trunk motion.
The result is a continuous record of how the joints and body segments move through the countermovement, propulsion, flight, and landing phases, including when they move, by how much, and how those movements are coordinated.
To see what this looks like in practice, the next section uses Theia3D as an example of a multi-camera markerless motion capture system analyzing a countermovement jump.
How Theia3D Works in a CMJ Workflow
Theia3D identifies over 120 anatomical landmarks on every visible person in the scene, then fits them to a skeletal model of 17 body segments.
Its deep-learning models have been trained on more than 100 million images across over 1,000 distinct environments to locate the anatomical landmarks in each frame.
Theia3D also integrates with external devices, including force plates, so joint-angle data and force data are provided for each jump.

Because anatomical landmarks are identified computationally rather than placed manually as markers, results are less dependent on who does the analysis. Consistent camera placement, calibration, lighting, and testing conditions are still important for comparable sessions.
How Markerless CMJ Testing Works in Practice
Theia3D can be set up wherever it's possible to mount multiple cameras. Users have recorded data at indoor and outdoor tracks, courts, gymnastics centers, weight rooms, and other applied movement settings.
A capture uses at least eight well-placed cameras recording fully synchronized video of the jump. Once the cameras are set up, the same capture volume can also be used for other movement-assessment tasks, such as a single leg squat assessment.
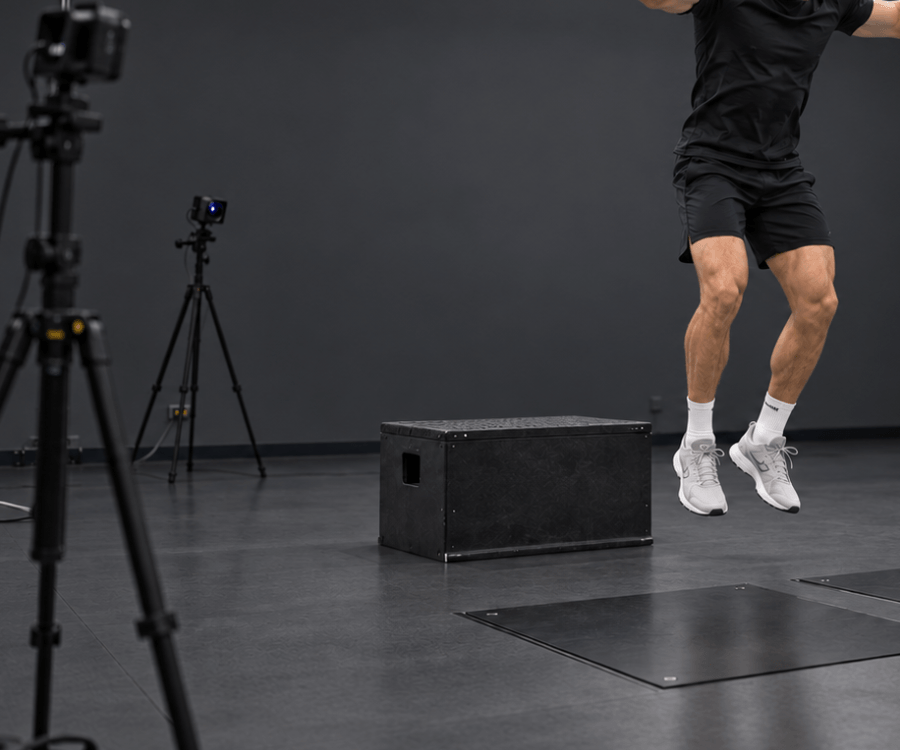
Not every camera system can record external device signals alongside video. To combine force-plate data with Theia3D kinematics, the camera system must support synchronized capture so that the video and force signals share the same timeline.
Before recording, the capture volume is calibrated using either the camera manufacturer's calibration board or a standard active wand moved through the space. Once calibration is complete, the athlete performs the CMJ within that capture volume.
Theia3D processes the video locally rather than in the cloud. It requires a CUDA-capable NVIDIA GPU with at least 8 GB of memory and compute capability 7.0 or higher, together with at least 24 GB of system RAM. Analysis can run without an internet connection, and video, participant, and analysis data are not transmitted to Theia or another external provider.
The resulting motion data can be exported as .C3D or .JSON for biomechanical analysis and as .FBX for animation. Theia3D can output both raw, unfiltered poses and smoothed, filtered poses. The data can then be used in environments such as Visual3D, Vicon Nexus, Qualisys Track Manager, Python, MATLAB, Excel, or an internal athlete-management system.
What the Research Says About Markerless Accuracy and Repeatability on Jumping Tasks
The case for adding joint-level data to the CMJ rests on independent, peer-reviewed evidence. Theia3D has been evaluated in more than 60 independent, peer-reviewed studies.
In a 2025 study published in Scientific Reports, researchers used Theia3D to analyze 14 male Division I collegiate athletes doing three types of vertical jump: squat jumps, drop jumps, and countermovement jumps, comparing the results against a Vicon marker-based system. That study found strong agreement for sagittal-plane knee and ankle joint angles, with differences of 3.5 degrees or less during most phases of the movement cycle.
Another study in the Journal of Sports Sciences from that year tested whether Theia3D could produce consistent measurements across separate testing sessions. Eighteen healthy participants performed six return-to-sport screening tasks, including the countermovement jump, during two sessions.
Most lower-body joint movement and force measurements showed moderate-to-good reliability between sessions, and the measurements of joint movement showed little variation from one session to the next. Reliability was also generally better for these movement measurements and for force-related measurements in the sagittal plane. Measurements of hip and ankle joint moments in the frontal plane were less reliable.
Separate work has tested whether markerless motion data can also be used to estimate the forces between the athlete and the ground. A 2024 study in the Journal of Biomechanics used Theia3D to capture whole-body movement during walking, running, cutting, and a vertical countermovement jump with an arm swing, then used the movement of the body segments to estimate three-dimensional ground-reaction forces. Across all three force directions and all four tasks, the average difference between the estimated and measured forces was 0.75 N/kg.
Two caveats apply to that figure:
- The 0.75 N/kg average covered all four tasks rather than the CMJ alone.
- For the jump, forces from the left and right sides were summed up to represent the total force acting on the body.
The study was a proof of principle that markerless movement data can be used to support estimates of whole-body ground-reaction force. As with any biomechanical system, Theia3D should be validated for the specific task, joint, and movement plane a given application needs, rather than assumed to be equally accurate in every use case.
Evaluate Markerless Motion Capture for Your Countermovement Jump Workflow
Talk to our team to see how Theia3D can fit into your jumping and movement assessment workflow.
Disclaimer: This article summarizes motion analysis approaches for research and performance applications. Theia3D is a motion analysis software platform and is not intended to diagnose or treat medical conditions. Interpretation and application of results are the responsibility of the user.