
Summary
Dean Jackson is a former professional pitcher who now trains athletes across MLB, AAA, Liga Mexicana, and other professional baseball environments. Dean’s IVA work examines how movement variables shift as pitchers move closer to max output, providing a clearer view of the biomechanical strategies each athlete uses to create velocity.
Incremental Velocity Analysis: Studying the Path to Max Output
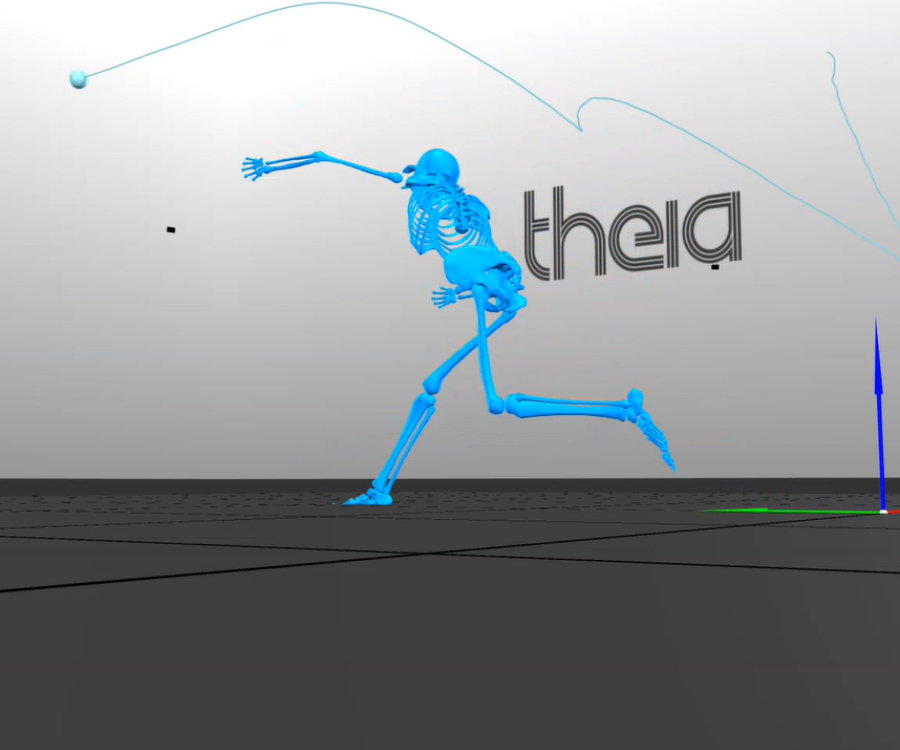
For his IVA datasets, Dean uses custom-built analysis tools that compare velocity against specific biomechanical variables from Theia3D.
The variables Dean analyzes include:
- Max Shoulder IR Ang Velo
- Max Shoulder ER Ang Velo
- Max Elbow Extension Ang Velo
- Peak Rotational Torque into Layback
- Max Shoulder Horiz Abd/Add Ang Velo into Max Scap Retraction
- Max Shoulder Horiz Abd/Add Ang Velo out of Max Scap Retraction
- Max Shoulder Horiz Abd
- Max Shoulder ER
- Max Global Torso Ang Velo (all 3 planes)
- Max Global Pelvis Ang Velo (X and Z planes)
- Max Torso-Pelvis Ang Velo (all 3 planes)
- Max CoM Velo (X and Z planes)
- Max Rear Hip Extension Ang Velo
- Max Rear Knee Extension Ang Velo
- Max Rear Ankle Extension Ang Velo
- Max Torso-Pelvis Angle (all 3 planes, min and max for X and Y)
- Max Hand Speed
Dean also uses tools that look at full signal data for positions and angular velocities across major body segments. This gives him a more detailed way to compare how movement patterns change across throws.
How Theia3D Connected Velocity to Movement
Many of the changes that matter in high-speed throwing are not easy to see accurately from video alone:
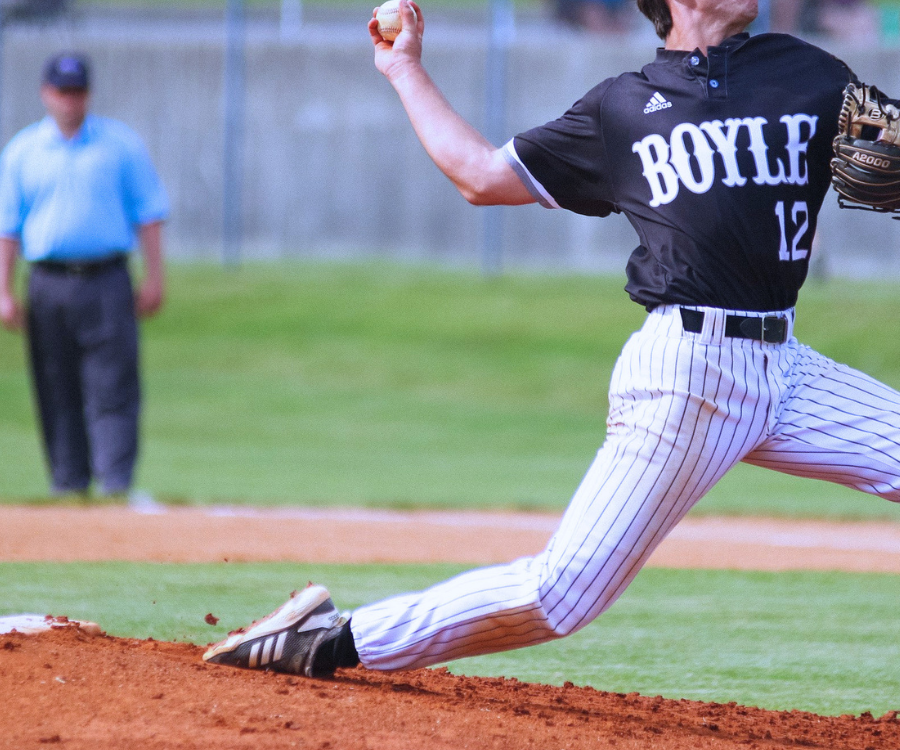
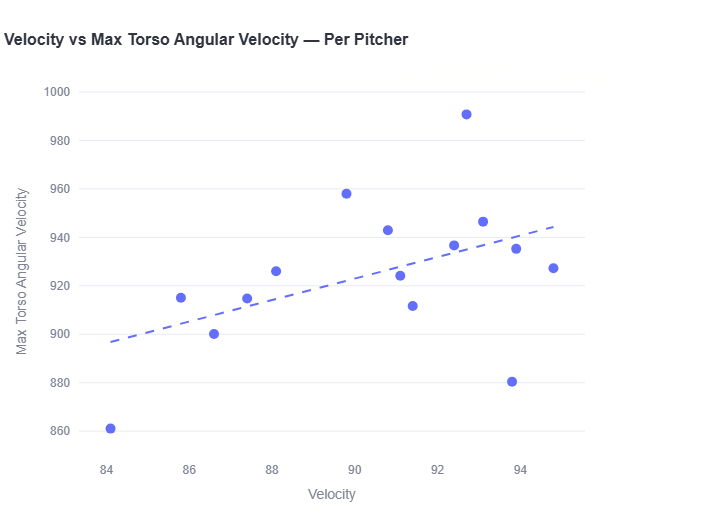
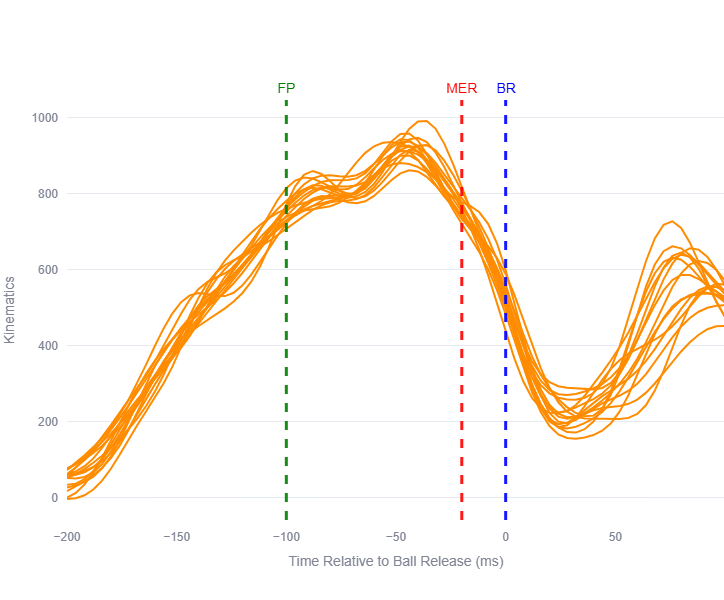
“Radar tells me what changed in the velocity, and I can see some visual changes with my eyes on video. But my eyes are not even close to the accuracy of Theia3D. For example, there’s not a chance I could tell the difference between a max torso angular velo of 860 deg/sec vs 960 deg/sec, but that's the difference between 84 and 92 for the athlete in Figure 1 above.”
The Takeaway: More Than One Way to Find Velocity
One of the more interesting takeaways from Dean’s IVA work is not just how many variables change as velocity increases, but how differently those changes show up from athlete to athlete:
“The main takeaway from the IVA project was that there's a huge number of different levers guys can pull to throw harder. Some are the main pathways coaches already understand as primary ways to add velocity. But there are also a lot of movements that seem to look more like compensations, that a lot of coaches would say are hurting the athlete.
Previously, I was mostly coaching one main pathway that I thought was most efficient. I still think that pathway is valuable, but IVA helped me see that there can also be value in understanding how an athlete already creates velocity. For example, if a high level pitcher already has great command and he just needs a tick or two, it may be easier to refine or leverage what he already does than teach him a completely new pattern.”
In this workflow, Theia3D enabled Dean to see that an athlete’s existing strategy may be more important, and more usable, than a coach can determine from radar or video alone.
See More
Interested in seeing how Theia3D can help connect pitching outputs to full-body movement data? Contact our team to learn how markerless motion capture can fit into your baseball performance workflow.