



Summary
Dean Jackson is a former professional pitcher who now trains athletes across MLB, AAA, Liga Mexicana, and other professional baseball environments. In the first article in this miniseries, Dean used incremental velocity analysis to examine where increases in pitching velocity came from across the kinetic chain.
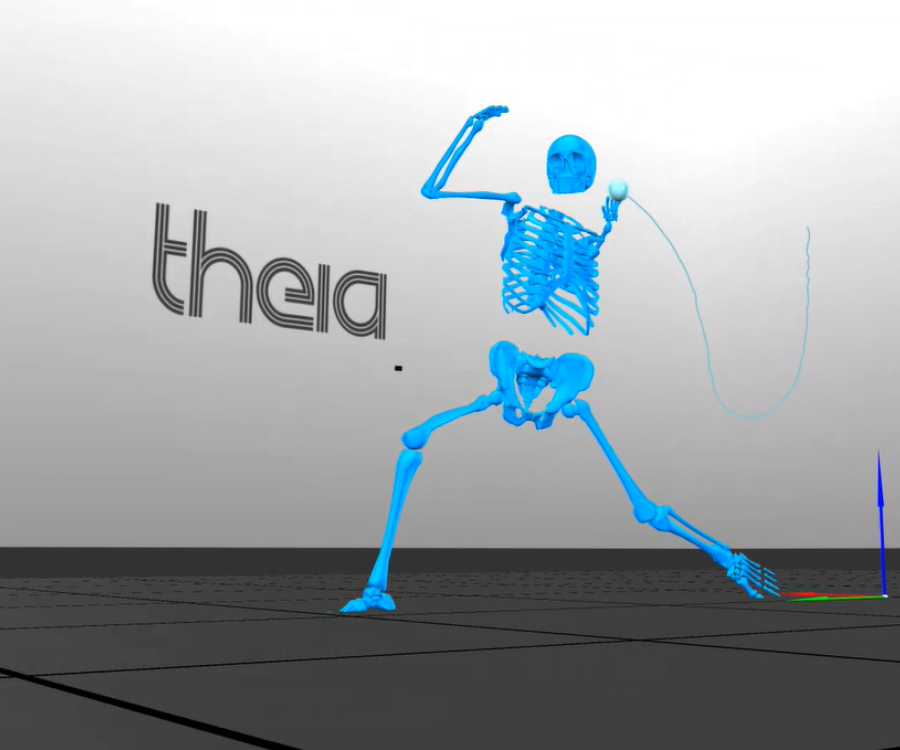
In this analysis, Dean used Theia3D to compare how quickly pitchers moved toward the plate during pulldowns and mound throws, then looked at shoulder external rotation angular velocity as an initial indicator of whether that added speed made its way into the arm.
Pulldowns vs. Mound Throws
Dean started by looking at how quickly each athlete moved toward the target during the stride phase of the throw. He measured this using peak center-of-gravity velocity toward the plate between peak knee height and foot plant. Most of the pitchers moved approximately 1.5 times faster during the pulldown than they did on the mound. From there, Dean wanted to see whether that additional speed showed up farther along in the throw.
Did the Added Speed Reach the Arm?
For this comparison, Dean focused on peak shoulder external rotation angular velocity: how quickly the arm moves into layback. He used it as a simple first check for whether the additional forward speed created during the pulldown was also showing up in the throwing arm.
The results were mixed. For some pitchers, the arm moved into external rotation faster during the pulldown. For others, it did not. One athlete, for example, reached approximately 1,300 degrees per second on the mound and 1,500 degrees per second during the pulldown. That is not a difference a coach could reliably identify by watching standard video.
“One of the pitchers’ arms laid back into external rotation at around 1,300 degrees per second on the mound and 1,500 degrees per second during a pulldown. You’d have no clue with just your eyes.”
Theia3D provided the full-body movement data Dean used to compare the two types of throws and measure how each athlete responded. Learn more about how Theia3D supports baseball biomechanics and ball tracking.
The Missing Link: Measuring What the Training Actually Changed
The mixed results reinforce the value of measuring how each athlete responds to a training method.
Most of the pitchers moved faster toward the target during the pulldown, but that additional speed did not affect the throwing arm in the same way for every athlete. For a coach, the more important question is not simply whether pulldowns are good or bad. It is what the drill is actually changing in the individual pitcher.
“With Theia, you can capture how an athlete moves before a training phase, during the pulldowns, and after they return to the mound. That shows you what the training actually changed, and what the athlete truly built from it. You can’t get that information without motion capture data.”
See More
Interested in measuring how your training methods change full-body pitching mechanics? Contact our team to learn how Theia3D can fit into your baseball performance workflow.